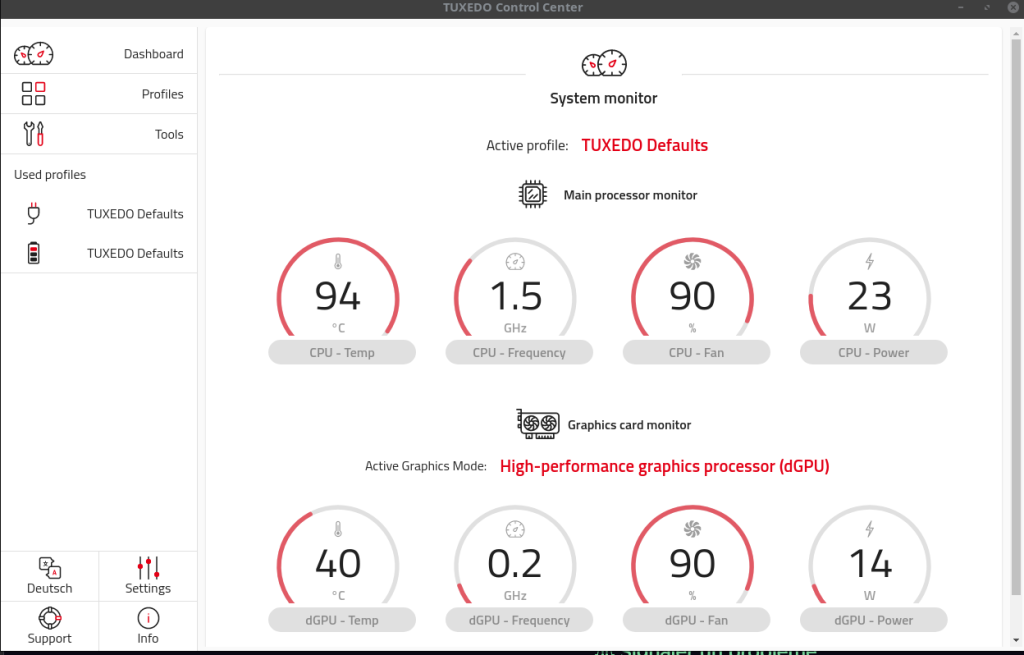
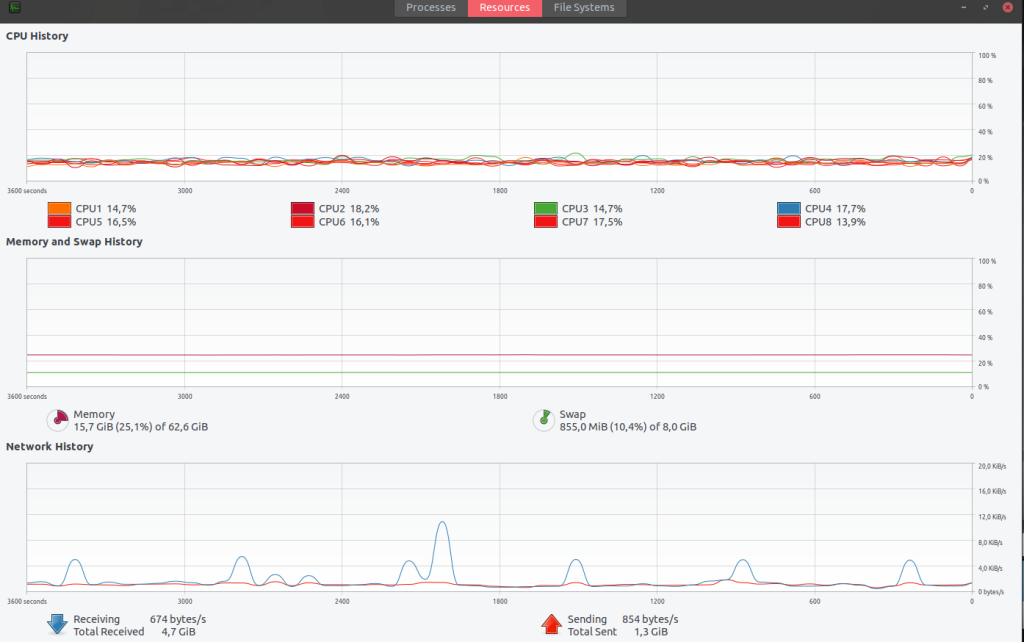
Now I have always high CPU load (process tccd) and fan at 100% … very good release !


And also impossible to put « Powersave extreme » or « Quiet » … the laptop stop after too hot.
My OS : 22.04.3 LTS (Jammy Jellyfish) .
Logs :
In loops :
$ grep "tccd" /var/log/syslog | tail -f
Dec 20 12:06:47 TUXEDO-Polaris-Intel-Gen3-TGL tccd[1152]: Authorization required, but no authorization protocol specified
Dec 20 12:06:47 TUXEDO-Polaris-Intel-Gen3-TGL tccd[1152]: Can't open display :1
Dec 20 12:06:47 TUXEDO-Polaris-Intel-Gen3-TGL tccd[1152]: Failed executing onWork() => Error: Command failed: export XAUTHORITY=/home/arias/.Xauthority && xrandr -q -display :1 --current
Dec 20 12:06:47 TUXEDO-Polaris-Intel-Gen3-TGL tccd[1152]: Authorization required, but no authorization protocol specified
Dec 20 12:06:47 TUXEDO-Polaris-Intel-Gen3-TGL tccd[1152]: Can't open display :1
Dec 20 12:06:50 TUXEDO-Polaris-Intel-Gen3-TGL tccd[1152]: Authorization required, but no authorization protocol specified
Dec 20 12:06:50 TUXEDO-Polaris-Intel-Gen3-TGL tccd[1152]: Can't open display :1
Dec 20 12:06:50 TUXEDO-Polaris-Intel-Gen3-TGL tccd[1152]: Failed executing onWork() => Error: Command failed: export XAUTHORITY=/home/arias/.Xauthority && xrandr -q -display :1 --current
Dec 20 12:06:50 TUXEDO-Polaris-Intel-Gen3-TGL tccd[1152]: Authorization required, but no authorization protocol specified
Dec 20 12:06:50 TUXEDO-Polaris-Intel-Gen3-TGL tccd[1152]: Can't open display :1
And also :
Dec 20 12:26:48 TUXEDO-Polaris-Intel-Gen3-TGL dbus-daemon[1100]: [system] The maximum number of pending replies for ":1.153" (uid=1000 pid=6362 comm="/opt/tuxedo-control-center/tuxedo-control-center -" label="unconfined") has been reached (max_replies_per_connection=1024)
Sensors :
# sensors
iwlwifi_1-virtual-0
Adapter: Virtual device
temp1:        +53.0°C

nvme-pci-2f00
Adapter: PCI adapter
Composite:    +47.9°C  (low  = -273.1°C, high = +81.8°C)
                       (crit = +84.8°C)
Sensor 1:     +47.9°C  (low  = -273.1°C, high = +65261.8°C)
Sensor 2:     +38.9°C  (low  = -273.1°C, high = +65261.8°C)

BAT0-acpi-0
Adapter: ACPI interface
in0:          16.42 V
curr1:         0.00 A

coretemp-isa-0000
Adapter: ISA adapter
Package id 0:  +82.0°C  (high = +100.0°C, crit = +100.0°C)
Core 0:        +50.0°C  (high = +100.0°C, crit = +100.0°C)
Core 1:        +68.0°C  (high = +100.0°C, crit = +100.0°C)
Core 2:        +49.0°C  (high = +100.0°C, crit = +100.0°C)
Core 3:        +82.0°C  (high = +100.0°C, crit = +100.0°C)
Core 4:        +49.0°C  (high = +100.0°C, crit = +100.0°C)
Core 5:        +59.0°C  (high = +100.0°C, crit = +100.0°C)
Core 6:        +49.0°C  (high = +100.0°C, crit = +100.0°C)
Core 7:        +49.0°C  (high = +100.0°C, crit = +100.0°C)

ucsi_source_psy_USBC000:001-isa-0000
Adapter: ISA adapter
in0:           0.00 V  (min =  +0.00 V, max =  +0.00 V)
curr1:         0.00 A  (max =  +0.00 A)

nvme-pci-0200
Adapter: PCI adapter
Composite:    +38.9°C  (low  = -273.1°C, high = +81.8°C)
                       (crit = +84.8°C)
Sensor 1:     +38.9°C  (low  = -273.1°C, high = +65261.8°C)
Sensor 2:     +42.9°C  (low  = -273.1°C, high = +65261.8°C)

acpitz-acpi-0
Adapter: ACPI interface
temp1:        +86.0°C  (crit = +100.0°C)
temp2:        +86.0°C  (crit = +119.0°C)


