Python : test de la librairie calplot

En passant

Le plus longs c’est de fixer les problèmes Python …

findfont: Font family 'Helvetica' not found.

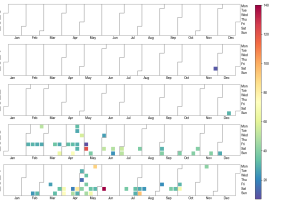
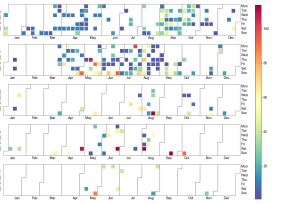
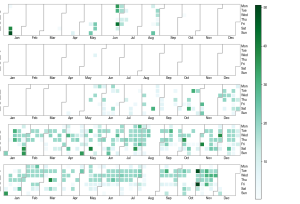
Ensuite quelques lignes de code :

import pandas as pd
import calplot
import pylab
from matplotlib import rcParams

df_tem = pd.read_csv('./VeloResume2020-2024-v4.csv', delimiter=";")
df_tem2 = df_tem.groupby([df_tem['date'].dt.date,'activity'])['km'].sum().reset_index().rename(columns={'sum':'km'})
df_tem2 = df_tem2.query('activity=="E-Biking"'
fig = calplot.calplot(df_tem2['km'],
                cmap="BuGn",
                fillcolor="w",
                linecolor="w",
                suptitle_kws=csfont,
                yearlabel_kws={'fontname':'sans-serif'},
                fig_kws=dict(facecolor="w"),
                subplot_kws=dict(facecolor="w"),
                edgecolor="grey")
pylab.savefig('E-Biking.png')

Python : matplotlib : Issue line 303 text.parse_math

Sur Kali OS j’ai eu cette erreur :


Bad key text.parse_math in file /usr/share/matplotlib/mpl-data/matplotlibrc, line 303 ('text.parse_math: False # Use mathtext if there is an even number of unescaped')
You probably need to get an updated matplotlibrc file from
https://github.com/matplotlib/matplotlib/blob/v3.5.2/matplotlibrc.template
or from the matplotlib source distribution
Traceback (most recent call last):
File "....Test.py", line 31, in <module>
import gradio as gr
File "/usr/local/lib/python3.11/dist-packages/gradio/__init__.py", line 3, in <module>
import gradio._simple_templates
File "/usr/local/lib/python3.11/dist-packages/gradio/_simple_templates/__init__.py", line 1, in <module>
from .simpledropdown import SimpleDropdown
File "/usr/local/lib/python3.11/dist-packages/gradio/_simple_templates/simpledropdown.py", line 6, in <module>
from gradio.components.base import FormComponent
File "/usr/local/lib/python3.11/dist-packages/gradio/components/__init__.py", line 1, in <module>
from gradio.components.annotated_image import AnnotatedImage
File "/usr/local/lib/python3.11/dist-packages/gradio/components/annotated_image.py", line 11, in <module>
from gradio import processing_utils, utils
File "/usr/local/lib/python3.11/dist-packages/gradio/processing_utils.py", line 23, in <module>
from gradio.utils import abspath
File "/usr/local/lib/python3.11/dist-packages/gradio/utils.py", line 38, in <module>
import matplotlib
File "/usr/lib/python3/dist-packages/matplotlib/__init__.py", line 880, in <module>
rcParamsDefault = _rc_params_in_file(
^^^^^^^^^^^^^^^^^^^
File "/usr/lib/python3/dist-packages/matplotlib/__init__.py", line 814, in _rc_params_in_file
config[key] = val # try to convert to proper type or raise
~~~~~~^^^^^
File "/usr/lib/python3/dist-packages/matplotlib/__init__.py", line 650, in __setitem__
raise ValueError(f"Key {key}: {ve}") from None
ValueError: Key grid.color: '"' does not look like a color arg

J’ai donc edité le fichier /usr/share/matplotlib/mpl-data/matplotlibrc pour mettre en commentaire la ligne ( sachant que False ou True on a la même erreur) :


##text.parse_math: True

Mais je suis pas sûr que cela fixe le problème … cela plante un peu plus loin.

Linux/Python : Merge d’un GPX et d’une video

Etape 1 : Installation : https://pypi.org/project/gopro-overlay/

$ python3 -m venv venv
$ venv/bin/pip install gopro-overlay
$ mkdir ~/.gopro-graphics/
$ cat ~/.gopro-graphics/ffmpeg-profiles.json
{
  "overlay": {
    "input": [],
    "output": ["-vcodec", "png"]
  }
}

Etape 2 : Premier test et premier drame

$ venv/bin/gopro-dashboard.py --use-gpx-only --gpx Nextcloud/Pipe/Video/BoucleResideo.gpx 1920x1080 Nextcloud/Pipe/Video/BoucleResideo.mov 
Starting gopro-dashboard version 0.100.0
ffmpeg version is 4.4.2-0ubuntu0.22.04.1
Using Python version 3.10.6 (main, May 29 2023, 11:10:38) [GCC 11.3.0]
Traceback (most recent call last):
  File "/home/arias/venv/bin/gopro-dashboard.py", line 107, in 
    font = load_font(args.font)
  File "/home/arias/venv/lib/python3.10/site-packages/gopro_overlay/font.py", line 5, in load_font
    return ImageFont.truetype(font=font, size=size)
  File "/home/arias/venv/lib/python3.10/site-packages/PIL/ImageFont.py", line 1008, in truetype
    return freetype(font)
  File "/home/arias/venv/lib/python3.10/site-packages/PIL/ImageFont.py", line 1005, in freetype
    return FreeTypeFont(font, size, index, encoding, layout_engine)
  File "/home/arias/venv/lib/python3.10/site-packages/PIL/ImageFont.py", line 255, in __init__
    self.font = core.getfont(
OSError: cannot open resource

Etape 2b : Avec copie de la « font »

$ venv/bin/gopro-dashboard.py --use-gpx-only --gpx Nextcloud/Pipe/Video/BoucleResideo.gpx --overlay-size 1920x1080 Nextcloud/Pipe/Video/BoucleResideo.mov --font Nextcloud/Pipe/Video/Roboto-Medium.ttf 
Starting gopro-dashboard version 0.100.0
ffmpeg version is 4.4.2-0ubuntu0.22.04.1
Using Python version 3.10.6 (main, May 29 2023, 11:10:38) [GCC 11.3.0]
GPX/FIT file:     2023-07-05T17:51:34+00:00 -> 2023-07-05T18:02:30+00:00
Timer(loading timeseries - Called: 1, Total: 2.99467, Avg: 2.99467, Rate: 0.33)
Generating overlay at Dimension(x=1920, y=1080)
Timeseries has 6561 data points
Processing....
Timer(processing - Called: 1, Total: 4.25000, Avg: 4.25000, Rate: 0.24)
FFMPEG Output is in /tmp/tmpkga_2k5h
Timelapse Factor = 1.000
Layout -> Include component 'date_and_time' = True
Layout -> Include component 'gps_info' = True
Layout -> Include component 'gps-lock' = True
Layout -> Include component 'big_mph' = True
Layout -> Include component 'gradient_chart' = True
Layout -> Include component 'gradient' = True
Layout -> Include component 'altitude' = True
Layout -> Include component 'temperature' = True
Layout -> Include component 'cadence' = True
Layout -> Include component 'heartbeat' = True
Layout -> Include component 'moving_map' = True
Layout -> Include component 'journey_map' = True
Executing 'ffmpeg -hide_banner -y -hide_banner -loglevel info -f rawvideo -framerate 10.0 -s 1920x1080 -pix_fmt rgba -i - -r 30 -vcodec libx264 -preset veryfast Nextcloud/Pipe/Video/BoucleResideo.mov'
...

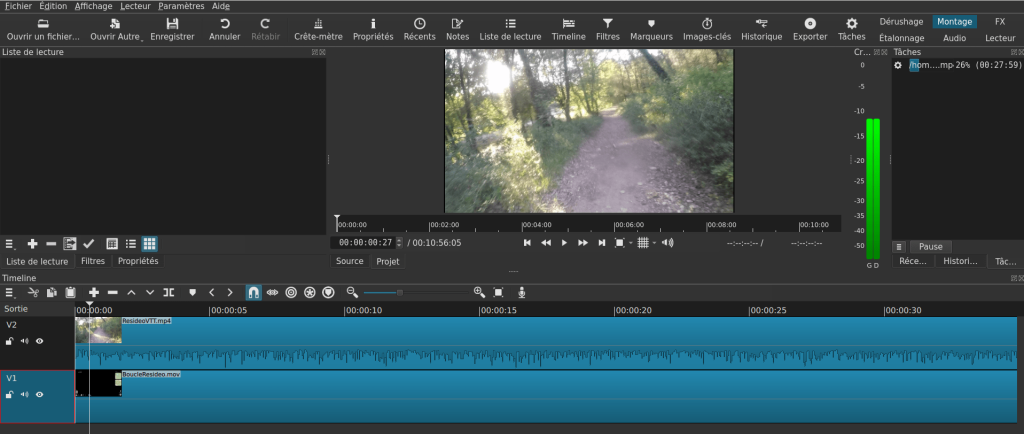
Etape 3 : Shotcut : https://shotcut.org/


Python : Creation de PNG à base de CSV, avec des EXIF de localisation

J’ai fait un petit programme pour faire des PNG à l’aide d’un fichier CSV. Le but est de mettre des balises sur Google Picture.

Voici un exemple de fichier CSV :

$ cat list.csv 
Nom,Année,Mois,Jours,Lieux,Pays
Deplacement sur Paris,2018,11,01,Paris,France
Deplacement sur Londres,2011,11,01,London,UK

Voici le programme :

from PIL import Image, ImageDraw, ImageFont
import piexif
from datetime import datetime
import csv
from geopy.geocoders import Nominatim
from GPSPhoto import gpsphoto

geolocator = Nominatim(user_agent="Your_Name")

with open('list.csv') as csv_file:
    csv_reader = csv.reader(csv_file, delimiter=',')
    line_count = 0
    for row in csv_reader:
        if line_count == 0:
            line_count += 1
        else:
            name = '%s \n Le %d/%d/%d \n a %s,%s . :' % (str(row[0]),int(row[1]),int(row[2]),int(row[3]),str(row[4]),str(row[5]))
            print('\t %s ' % name)
            line_count += 1
            filename = 'image-%d.jpg' % (line_count)

            img = Image.new('RGB', (1024, 800), color = (73, 109, 137))

            d = ImageDraw.Draw(img)
            fontsize = 80 
            font = ImageFont.truetype('/usr/share/fonts/truetype/msttcorefonts/Arial.ttf', fontsize)
            d.text((10,10), name, font=font)
            img.save(filename)

            exif_dict = piexif.load(filename)
            new_date = datetime(int(row[1]), int(row[2]), int(row[3]), 0, 0, 0).strftime("%Y:%m:%d %H:%M:%S")
            exif_dict['0th'][piexif.ImageIFD.DateTime] = new_date
            exif_dict['Exif'][piexif.ExifIFD.DateTimeOriginal] = new_date
            exif_dict['Exif'][piexif.ExifIFD.DateTimeDigitized] = new_date
            exif_bytes = piexif.dump(exif_dict)
            piexif.insert(exif_bytes, filename)
            address= '%s,%s' % (row[4], row[5])
            location = geolocator.geocode(address)
            print('\t\t %f %f %d' % (location.latitude, location.longitude, location.altitude))
            photo = gpsphoto.GPSPhoto(filename)
            info = gpsphoto.GPSInfo((location.latitude, location.longitude), alt=int(location.altitude), timeStamp=new_date)
            photo.modGPSData(info, filename)

    print('Processed %d lines.' % line_count)


Pour qu’il fonctionne il faut avoir installé :

# pip install geopy
# pip install GPSPhoto
# pip install exifread

Pour l’installation des fonts sous Ubuntu :

# sudo apt-get install gsfonts gsfonts-other gsfonts-x11 ttf-mscorefonts-installer t1-xfree86-nonfree fonts-alee ttf-ancient-fonts fonts-arabeyes fonts-arphic-bkai00mp fonts-arphic-bsmi00lp fonts-arphic-gbsn00lp fonts-arphic-gkai00mp fonts-atarismall fonts-dustin fonts-f500 fonts-sil-gentium ttf-georgewilliams ttf-isabella fonts-larabie-deco fonts-larabie-straight fonts-larabie-uncommon ttf-sjfonts ttf-staypuft ttf-summersby fonts-ubuntu-title ttf-xfree86-nonfree xfonts-intl-european xfonts-jmk xfonts-terminus

Pour vérifier :

# exiftool image-2.jpg 
ExifTool Version Number         : 11.88
File Name                       : image-2.jpg
Directory                       : .
File Size                       : 36 kB
File Modification Date/Time     : 2021:02:22 14:55:29+01:00
File Access Date/Time           : 2021:02:22 14:55:30+01:00
File Inode Change Date/Time     : 2021:02:22 14:55:29+01:00
File Permissions                : rw-rw-r--
File Type                       : JPEG
File Type Extension             : jpg
MIME Type                       : image/jpeg
JFIF Version                    : 1.01
Resolution Unit                 : None
X Resolution                    : 1
Y Resolution                    : 1
Exif Byte Order                 : Big-endian (Motorola, MM)
Modify Date                     : 2018:11:01 00:00:00
Date/Time Original              : 2018:11:01 00:00:00
Create Date                     : 2018:11:01 00:00:00
GPS Latitude Ref                : North
GPS Longitude Ref               : East
GPS Altitude Ref                : Above Sea Level
GPS Time Stamp                  : 00:00:00
GPS Processing Method           : GPS
GPS Date Stamp                  : 2018:11:01
Image Width                     : 1024
Image Height                    : 800
Encoding Process                : Baseline DCT, Huffman coding
Bits Per Sample                 : 8
Color Components                : 3
Y Cb Cr Sub Sampling            : YCbCr4:2:0 (2 2)
Image Size                      : 1024x800
Megapixels                      : 0.819
GPS Altitude                    : 0 m Above Sea Level
GPS Date/Time                   : 2018:11:01 00:00:00Z
GPS Latitude                    : 48 deg 51' 24.11" N
GPS Longitude                   : 2 deg 21' 5.26" E
GPS Position                    : 48 deg 51' 24.11" N, 2 deg 21' 5.26" E