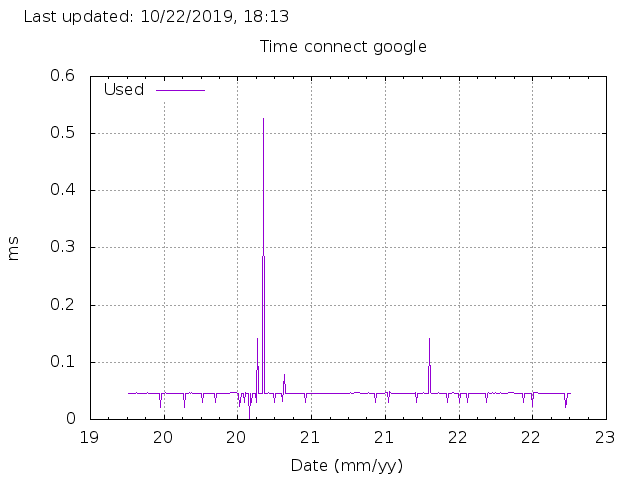
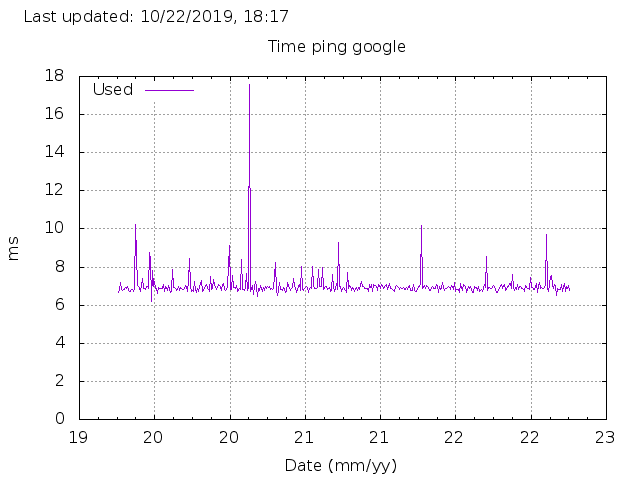
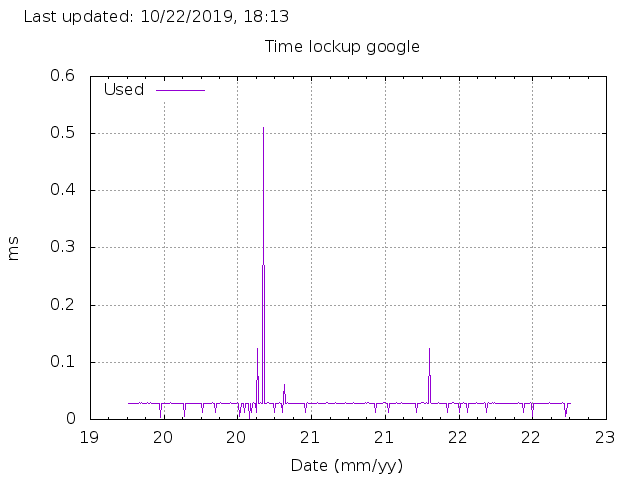
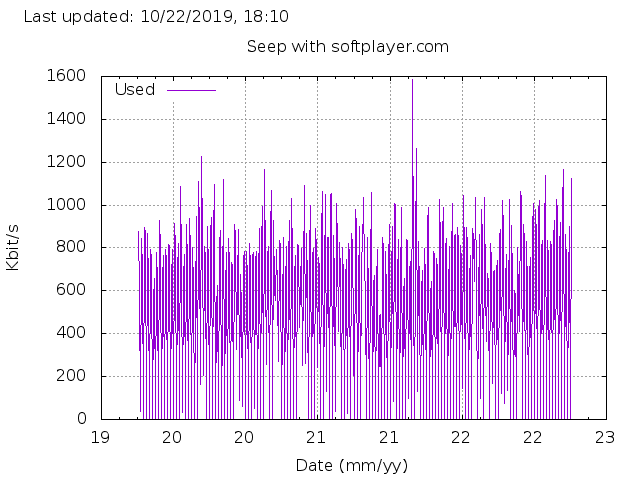
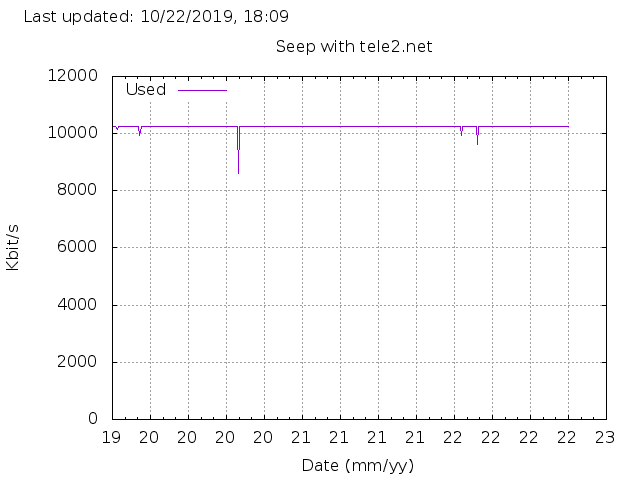
Voici donc les résultats ( cela fait suite à l’article https://www.cyber-neurones.org/2019/10/mon-script-de-test-de-debit/ ) :
#!/usr/bin/gnuplot

set terminal png font "helvetica"
set output 'speed_tele2_graph.png'

set title "Download with tele2.net "
set timestamp "Last updated: %m/%d/%Y, %H:%M" top

set xlabel "Date (mm/yy)"
set timefmt "%Y/%m/%d %H:%M:%S"
set xdata time
set format x "%d"

set ylabel "Kbit/s"
set yrange [ 0 : ]

set key left
set grid
set datafile separator whitespace

plot '/var/run/speed.log'     using 1:4 t 'Used' with lines

#!/usr/bin/gnuplot

set terminal png font "helvetica"
set output 'speed_connect_google_graph.png'

set title "Time connect google "
set timestamp "Last updated: %m/%d/%Y, %H:%M" top

set xlabel "Date (mm/yy)"
set timefmt "%Y/%m/%d %H:%M:%S"
set xdata time
set format x "%d"

set ylabel "ms"
set yrange [ 0 : ]

set key left
set grid
set datafile separator whitespace

plot '/var/run/speed.log'     using 1:5 t 'Used' with lines

#!/usr/bin/gnuplot

set terminal png font "helvetica"
set output 'speed_lockup_google_graph.png'

set title "Time lockup google "
set timestamp "Last updated: %m/%d/%Y, %H:%M" top

set xlabel "Date (mm/yy)"
set timefmt "%Y/%m/%d %H:%M:%S"
set xdata time
set format x "%d"

set ylabel "ms"
set yrange [ 0 : ]

set key left
set grid
set datafile separator whitespace

plot '/var/run/speed.log'     using 1:6 t 'Used' with lines

#!/usr/bin/gnuplot

set terminal png font "helvetica"
set output 'speed_ping_google_graph.png'

set title "Time ping google "
set timestamp "Last updated: %m/%d/%Y, %H:%M" top

set xlabel "Date (mm/yy)"
set timefmt "%Y/%m/%d %H:%M:%S"
set xdata time
set format x "%d"

set ylabel "ms"
set yrange [ 0 : ]

set key left
set grid
set datafile separator whitespace

plot '/var/run/speed.log'     using 1:8 t 'Used' with lines

#!/usr/bin/gnuplot

set terminal png font "helvetica"
set output 'speed_softplayer_graph.png'

set title "Download with softplayer.com "
set timestamp "Last updated: %m/%d/%Y, %H:%M" top

set xlabel "Date (mm/yy)"
set timefmt "%Y/%m/%d %H:%M:%S"
set xdata time
set format x "%d"

set ylabel "Kbit/s"
set yrange [ 0 : ]

set key left
set grid
set datafile separator whitespace

plot '/var/run/speed.log'     using 1:3 t 'Used' with lines

